
There is a nice micro-animation library at useanimations.com which contains some useful animations which are particularly well suited for animated icons. These are all free to use and downloadable at Lottie animations. For those that already use Lottie they can use these animations as-is. However using them is apps which don’t use Lottie, or in cases where they may need tweaking and you don’t have a designer available that can perform the necessary tweaks in After Effects, it may not be possible to do this. In this occasional series we’ll look at how to create some of these animations as Animated Vector Drawables which will show some useful AVD techniques.

The transition that we’re going to look at in this article is between the three lines used to represents a menu (which has become known as the burger menu) to a stylised edible burger – as seen on the left. While the use of the burger menu as a UI component in apps has been declining of late, the transition itself is quite interesting and the techniques that it uses can be useful in other cases. So I feel that it’s worthy of study.
The bottom two lines have a translateY applied to them which cause them both to move downwards, albeit at offset start times. We’ve covered this technique previously in this series, so we won’t go in to detail here. Instead we’ll focus on the transition of the top line to a curve representing the top of the burger bug; and the drip that appears on the second middle line.
We’re previously looked at using the SVG path data arc command to create segments of ellipses and although we could do the same here, there’s actually a different way that we can do this. The burger bun shape above is not actually a n elliptical arc, and although we could get close to the shape above using that technique, we get more flexibility (and easier animation) if we use a quadratic bezier instead.
A quadratic bezier command consist of three pairs of coordinates. The curve will be drawn from the current position on the canvas to point represented by the final pair of coordinates, and the shape of the curve will be determined by the remaining two pairs of coordinates, which are the two control points. Anyone familiar with drawing software such as Adobe Illustrator and Sketch should be familiar with using control points to control the shape of curves, and that is precisely what these control points are doing. For those unfamiliar with such software the concept is pretty easy to understand.
The full SVG path data to draw the curve representing the top of the bun is:
M8,0 C 13,-22 51,-22 56,0
We first move to position 8,0, then draw a curve ending at 56,0 with control points at 13,-22 and 51,-22. We can visualise this as follows:
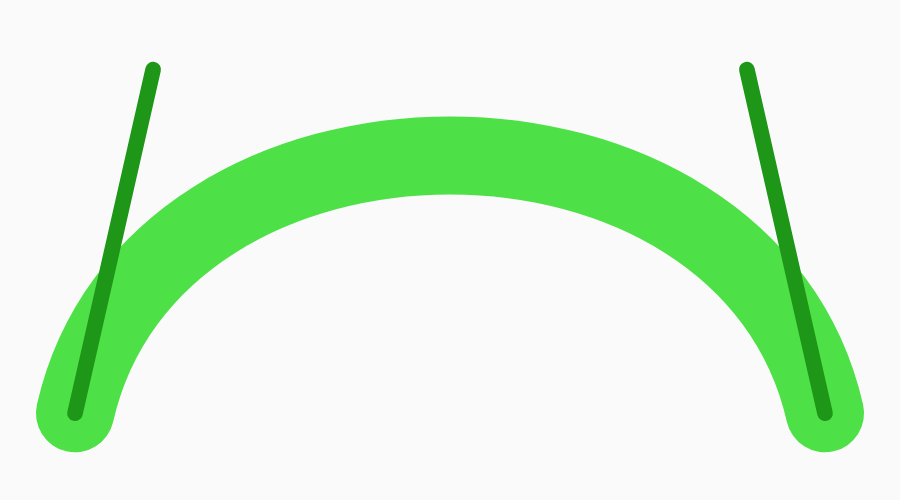
The lighter green line is the actual curve that we’re drawing, and the two darker green lines are lines drawn from the start point to the first control point, and the end point to the second control point. Note how at the start of the lighter green curve it follows the darker green line showing the direction to the first control point, and as it reaches the end point it follows the darker green line showing the direction from the second control point to the end point.
A curve of cubic bezier is determined by tending towards the first control point at the start with no influence from the second control point. But as we progress along the curve, the relative amounts of influence of the two control points changes with the influence of the first starting high and dropping as we progress along the curve; and the second having no influence at first but gradually increasing as we progress.
By changing the position of the either or both of the control points the resultant shape of the curve will change, also. In this case the curve is a dome shape because both of the control points are above the start and end points. If we were to move both control points below the start and end points we’d create a bowl shape instead.
If both control points were to be on the straight line between the start and end points, then a straight line would be drawn, and that is precisely what we do in the animation to transition between a curve and a line. The path data for the line is:
M8,0 C 13,0 51,0 56,0
The only difference between the previous path data is the y coordinates of the two control points are now 0 instead of -22. So these now lie on the straight line between the start and end points producing a straight line. Animating between these two path data causes the line to grow in to the dome shape and vice versa.
The other thing worthy of study is the drip that appears to the right of the middle line towards the end of the transition to the stylised edible burger. This is achieved using a simple triangle shape, and the triangle is the same height as the middle line. In the burger menu vector this sits on top of, and aligned with the middle line. They are the same colour so the triangle is not visible. Here it is coloured red:
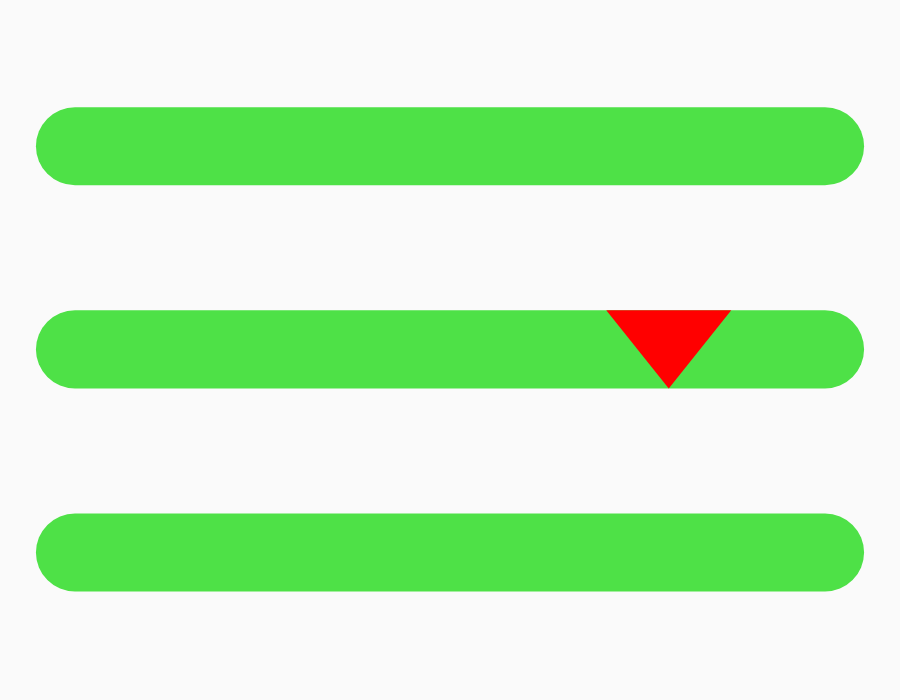
This moves down in tandem with the middle line, so it remains hidden. When it is ready to be shown, it is moved down while keeping the middle line static, and the drip seems to appear late on:

The red colouring makes it easy to see what is going on, but once we match the colours the illusion created in final animation the final animation is quite nice:
As is always the case, the timings of the various offsets here does not match those of the useanimations.com version of this, but I still feel this this is quite a pleasing and fun transition nonetheless.
The source code for this article is available here.
© 2020, Mark Allison. All rights reserved.
Copyright © 2020 Styling Android. All Rights Reserved.
Information about how to reuse or republish this work may be available at http://blog.stylingandroid.com/license-information.